ストライクゾーンのデータ (pybaseball)
SHOGAKU
3 years ago
引き続き、pybaseball / MLBデータ分析ライブラリ にて、MLBの触れるデータを確認した。
今回はストライクゾーンについて、データを見てみた。
コード備忘録の意味合いが強い
全体やダルビッシュなどのデータで確認 (2021年)
!pip install pybaseball
from pybaseball import statcast
df = statcast(start_dt='2021-04-01', end_dt='2021-12-31')
df_506433 = df[df['pitcher'] == 506433]
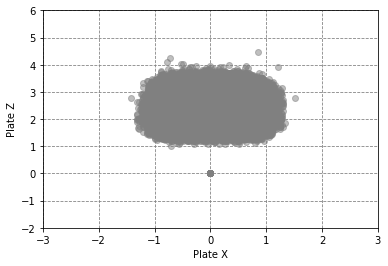
全部の見逃しストライク
df_Allstrike = df[df['type'] == 'S']
df_Allstrike = df_Allstrike[df_Allstrike['description'] == 'called_strike']

# NaNの値を含む行を削除
df_Allstrike.dropna(subset=['plate_x', 'plate_z'], inplace=True)

plt.scatter(df_Allstrike['plate_x'], df_Allstrike['plate_z'], color='gray', alpha=0.5)
plt.xlim(-3, 3)
plt.ylim(-2, 6)
plt.xlabel('Plate X')
plt.ylabel('Plate Z')

# 罫線
plt.grid(which='both', linestyle='--', color='gray', alpha=1)

plt.show()
全部の見逃しボール
df_Allball = df[df['type'] == 'B']

# NaNの値を含む行を削除
df_Allball.dropna(subset=['plate_x', 'plate_z'], inplace=True)

plt.scatter(df_Allball['plate_x'], df_Allball['plate_z'], color='gray', alpha=1)
#plt.xlim(-3, 3)
#plt.ylim(-2, 6)
plt.xlabel('Plate X')
plt.ylabel('Plate Z')

# 罫線
plt.grid(which='both', linestyle='--', color='gray', alpha=1)

plt.show()
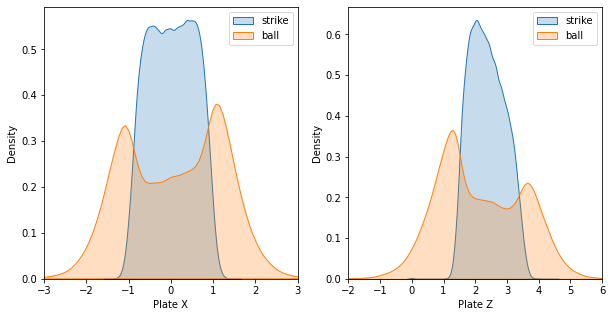
ストライク&ボールゾーン - カーネル密度推定
# ストライクゾーン。カーネル密度推定


import seaborn as sns

fig, axs = plt.subplots(1,2, figsize=(10,5))
sns.kdeplot(data=df_Allstrike['plate_x'], shade=True, ax=axs[0], label='strike')
sns.kdeplot(data=df_Allball['plate_x'], shade=True, ax=axs[0], label='ball')
sns.kdeplot(data=df_Allstrike['plate_z'], shade=True, ax=axs[1], label='strike')
sns.kdeplot(data=df_Allball['plate_z'], shade=True, ax=axs[1], label='ball')
axs[0].set_xlim(-3, 3)
axs[1].set_xlim(-2,6)
axs[0].set_xlabel('Plate X')
axs[1].set_xlabel('Plate Z')
axs[0].legend()
axs[1].legend()
plt.show()
上記の場合、余計な部分も入っているので、密度測定の交点部分からXY範囲を絞り再度カーネル密度測定
交点は計算で求められないので目視対応
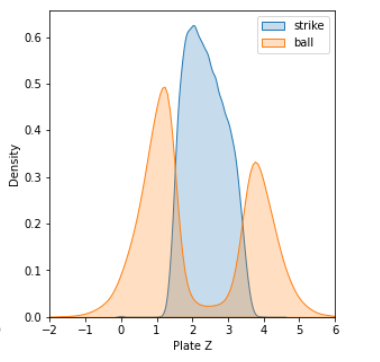
# X座標 -0.8883~0.8882に絞って、Zのストライク判定を見る

df_strike_x_range = df_Allstrike[(df_Allstrike['plate_x'] >= -0.8883) & (df_Allstrike['plate_x'] <= 0.8882)]
df_ball_x_range = df_Allball[(df_Allball['plate_x'] >= -0.8883) & (df_Allball['plate_x'] <= 0.8882)]

fig, axs = plt.subplots(1,2, figsize=(10,5))
#sns.kdeplot(data=df_strike_x_range['plate_x'], shade=True, ax=axs[0], label='strike')
#sns.kdeplot(data=df_ball_x_range['plate_x'], shade=True, ax=axs[0], label='ball')
sns.kdeplot(data=df_strike_x_range['plate_z'], shade=True, ax=axs[1], label='strike')
sns.kdeplot(data=df_ball_x_range['plate_z'], shade=True, ax=axs[1], label='ball')
#axs[0].set_xlim(-0.895, 0.855)
axs[1].set_xlim(-2,6)
axs[0].set_xlabel('Plate X')
axs[1].set_xlabel('Plate Z')
axs[0].legend()
axs[1].legend()
plt.show()
# Y座標 1.508~3.375に絞って、Xのストライク判定を見る

df_strike_z_range = df_Allstrike[(df_Allstrike['plate_z'] >= 1.508) & (df_Allstrike['plate_z'] <= 3.375)]
df_ball_z_range = df_Allball[(df_Allball['plate_z'] >= 1.508) & (df_Allball['plate_z'] <= 3.375)]

fig, axs = plt.subplots(1,2, figsize=(10,5))
sns.kdeplot(data=df_strike_z_range['plate_x'], shade=True, ax=axs[0], label='strike')
sns.kdeplot(data=df_ball_z_range['plate_x'], shade=True, ax=axs[0], label='ball')
# sns.kdeplot(data=df_strike_z_range['plate_z'], shade=True, ax=axs[1], label='strike')
# sns.kdeplot(data=df_ball_z_range['plate_z'], shade=True, ax=axs[1], label='ball')
# axs[0].set_xlim(-0.895, 0.855)
# axs[1].set_xlim(-2,6)
axs[0].set_xlabel('Plate X')
axs[1].set_xlabel('Plate Z')
axs[0].legend()
axs[1].legend()
plt.show()
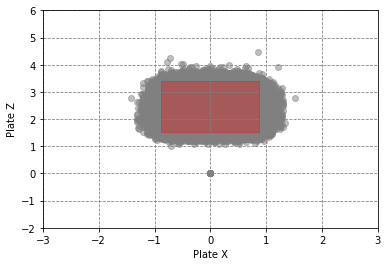
全部の見逃しストライクグラフに図示
カーネル密度関数のグラフの交点箇所を座標として四角形を作成
df_Allstrike = df[df['type'] == 'S']
df_Allstrike = df_Allstrike[df_Allstrike['description'] == 'called_strike']

# NaNの値を含む行を削除
df_Allstrike.dropna(subset=['plate_x', 'plate_z'], inplace=True)

plt.scatter(df_Allstrike['plate_x'], df_Allstrike['plate_z'], color='gray', alpha=0.5)
plt.xlim(-3, 3)
plt.ylim(-2, 6)
plt.xlabel('Plate X')
plt.ylabel('Plate Z')

# ストライクゾーン
import matplotlib.pyplot as plt

x = [-0.88, 0.88, 0.88, -0.88, -0.88]
y = [1.51, 1.51, 3.4, 3.4, 1.51]
plt.fill(x, y, color='r', alpha=0.3)


# 罫線
plt.grid(which='both', linestyle='--', color='gray', alpha=1)

plt.show()
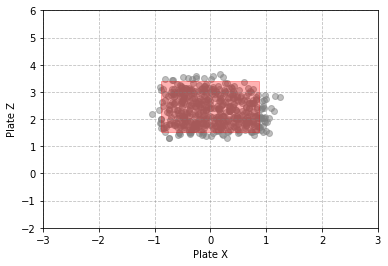
ダルビッシュ投手のデータで確認
見逃しストライク
全体だと余計なものもplotされているのでダルビッシュ選手で確認
df_506433 = df[df['pitcher'] == 506433]
# df_strike = df_506433[df_506433['type'] == 'S']
df_strike = df_strike[df_strike['description'] == 'called_strike']

# NaNの値を含む行を削除
df_strike.dropna(subset=['plate_x', 'plate_z'], inplace=True)

plt.scatter(df_strike['plate_x'], df_strike['plate_z'], color='gray', alpha=0.5)
plt.xlim(-3, 3)
plt.ylim(-2, 6)
plt.xlabel('Plate X')
plt.ylabel('Plate Z')

# ストライクゾーン

import matplotlib.pyplot as plt

x = [-0.88, 0.88, 0.88, -0.88, -0.88]
y = [1.51, 1.51, 3.4, 3.4, 1.51]
plt.fill(x, y, color='r', alpha=0.3)


# 罫線
plt.grid(which='both', linestyle='--', color='gray', alpha=0.5)

plt.show()
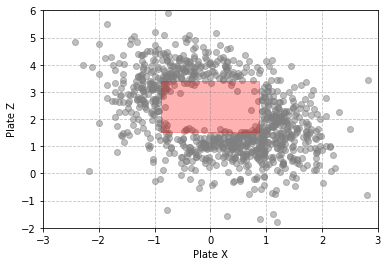
ボール
df_506433 = df[df['pitcher'] == 506433]
df_506433ball = df_506433[df_506433['type'] == 'B']

# NaNの値を含む行を削除
df_506433ball.dropna(subset=['plate_x', 'plate_z'], inplace=True)

plt.scatter(df_506433ball['plate_x'], df_506433ball['plate_z'], color='gray', alpha=0.5)
plt.xlim(-3, 3)
plt.ylim(-2, 6)
plt.xlabel('Plate X')
plt.ylabel('Plate Z')

# ストライクゾーン

import matplotlib.pyplot as plt

x = [-0.88, 0.88, 0.88, -0.88, -0.88]
y = [1.51, 1.51, 3.4, 3.4, 1.51]
plt.fill(x, y, color='r', alpha=0.3)


# 罫線
plt.grid(which='both', linestyle='--', color='gray', alpha=0.5)

plt.show()
この考え方でゾーンを描くと、やや狭くなる
コメント
いいね
投げ銭
最新順
人気順
コメント
いいね
投げ銭
最新順
人気順
